Google Map Project
Digital maps and related applications are indispensable for our students’ geo-spatial, contextual, and phenomenological navigation through the world. Researchers at the MIT Media Lab posit that the human brain is a “system in which affective functions and cognitive ones are inextricably integrated with one another.”[1] To take advantage of this connection I designed a learning experience that integrated students’ phenomenological understanding of place, digital perception of it, and knowledge of it derived through research.
I selected Google Maps to realize this objective and to achieve student learning outcomes informed by information literacy and the overlapping realm of information technology fluency. Because Google Maps are ubiquitous and familiar, free, and customizable, they are an excellent tool for designing rich educational experiences where several kinds of learning take place simultaneously.
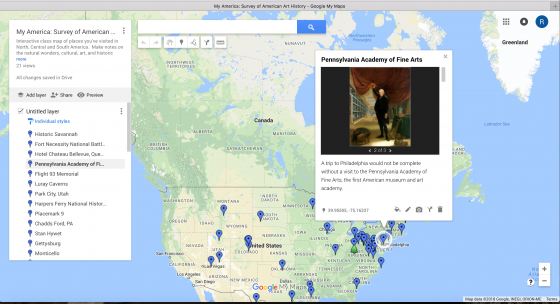
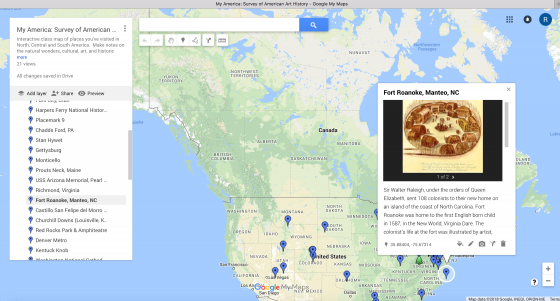
For the Google Map Project I created Google Map Project_Instructions, a Google Map Project Worksheet, an Evaluation Worksheet, a Google Map Project_Rubric and provided a link to the “How to Use Google Maps Guide.” I also developed a collaborative Google Map with a model entry that included an annotated essay with images, citations that linked to online sources, and “cascading” links that extended research opportunities for readers. In later iterations the rubric also became the basis for a peer review feedback guide.
In the first iteration of this assignment for my Art of the United States course, students began the initial week of the semester researching something they were already familiar with or were positively disposed toward, in other words an emotional involvement leading to intellectual involvement. Students were asked to pin three places to a collaborative Google Map: somewhere they wanted to explore and two places they had visited. Scholarship suggests that “positive affect increases intrinsic motivation.” [2]
Because interest is an important factor in the learning process, students were asked to examine places they wanted to explore, with one caveat; they had to select sites based on their artistic, historical, or cultural contributions to the United States. If they chose a place more often noted for its historical or cultural importance (e.g. Yellowstone), they had to demonstrate through their research there was a connection to the arts (e.g. a Thomas Moran painting, a William Henry Jackson photograph), justify the assertion on their Project Worksheet and address it through their essay pinned on the Google Map.
In another semester, the Google Maps Project was the final assignment and extended students’ main research project. They had to add one pin derived from their semester’s work and examine it through the theme of place. Again, all pins had to include a significant visual art connection. Students did not have to add “exciting” places to the map, since their grade did not depend on where they had visited or wanted to go but on the quality of the research and writing about that place.
In an era of information surplus and easy online access, students have a plethora of information, but understanding the need to evaluate online resources and knowing how to do so in a critical manner can be problematic. To practice the skill of evaluating open-source internet material, students were required to use online sources, with the exception of those derived from their major research paper.
We met with our librarian for a tutorial on the critical assessment of online sources. Students completed at least four evaluation worksheets, based on the California State University, Chico’s CRAAP test (Currency, Relevance, Authority, Accuracy, Purpose) but altered slightly for this course. The worksheets helped students understand the types of questions they should ask when using websites. Students had to investigate at least six websites per pin for an “A” and complete an evaluation worksheet for four of those sites. The importance of evaluating websites was reinforced by their having to rank and justify using their selected websites on their project worksheet and hand in their evaluation worksheets with it.
On the project worksheet students noted: the place researched; a brief explanation of why they chose that place; a list of four internet sites with full ULRs; a ranking of the quality of the four sites; an explanation of what made their first and last choices the most and least scholarly and reliable; additional information such as links, images, panoramas, maps, YouTube videos, etc. that they selected to enrich the pinned site, an explanation for why they made those choices; and a reflection statement addressing what they learned from the assignment and how they could use those skills and knowledge outside of this course. Students also attached a copy of their essay to the project worksheet.
In all iterations of the Google Maps Project, students gave oral presentations using the collaborative map to share their physical and digital experiences and research-based exploration of art in the U.S.

[1] R. W. Piucard et al. “Affective Learning—A Manifesto” BT Technology Journal 22 no. 4 (October 2004): 253.
[2] Piucard, 254.